|
My process |
Fieldwork and data science
|
Remote sensing
I use camera trapping and GPS telemetry to monitor wildlife on the ground, and satellite imagery to monitor habitat alterations from above I This |
Coding
I use ArcGIS (Python), Google Earth Engine (Javascript), and R to conduct spatial analyses, perform statistics and visualize data |
Urban centers as ecological traps

As part of a NASA Biodiversity grant, we investigated the impacts of urban centers and artificial light on bird migration. Specifically, we looked at the timing and success of migration, and the potential mechanisms that cause migrating birds to be attracted to artificial light.
Collaborators: Jeff Henebry, Sharolyn Anderson, Monika Tomaszewska, Fengyi Guo, Jeff Buler, Daniel Sheldon, Adriaan Dokter, Carolyn Burt, Kyle Horton
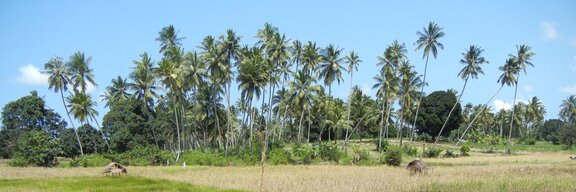
A community forest in Pemba, Tanzania
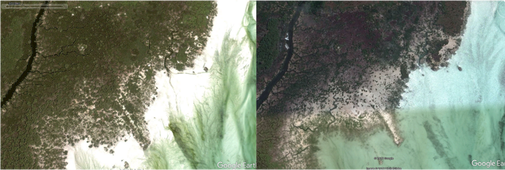
Mangrove forest in 2002 versus 2016. Satellite imagery: Google Earth
|
Climate change & deforestation How effective is community-based forest management in developing countries? Do payments for ecosystem services work in Reducing Emissions from Deforestation and forest Degradation (REDD+) programs? I use remote sensing and statistical matching to provide answers to these questions.
Collaborators: Monique Borgerhoff Mulder, Tim Caro, Mark Grote, Jim Thorne, Ani Ghosh, Jon Salerno "I've got the REDD+ blues" Blog post |
|
Artificial light & noise pollution Does traffic-induced noise and light disturbance alter spatiotemporal patterns of habitat use in mammals?
Do prey and/or mesopredators fear traffic noise? I am addressing these questions by monitoring wildlife movement and behavior at crossing structures and wilderness areas across California, USA. Collaborators: Fraser Shilling, Travis Longcore, Winston Vickers Click here to see wildlife images |
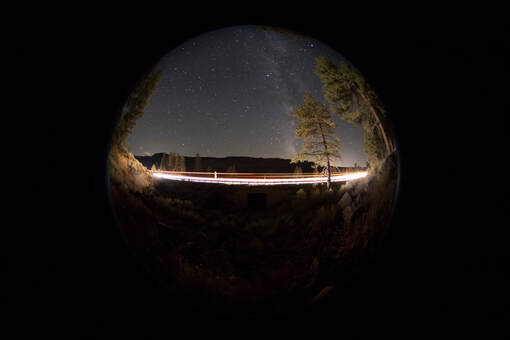
Light pollution at a crossing structure, highway 80, California.
Image Source: Ben Banet |
|
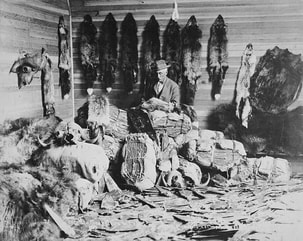
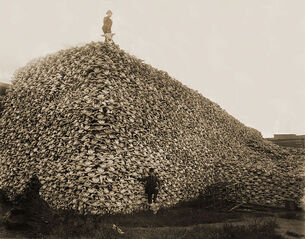
Shifting population baselines Using Hudson's Bay Company data that dates back to 1850, we look at historical population decline, and provide context for present-day species population trends.
Collaborators: Monni Bohm, Ben Collen |
|